
Every fiber link is a chain of lossy joints: connectors at each patch panel, fusion splices every few kilometers, bends inside trays and conduits. A single dirty end face or a splice pulled too tight can consume enough of the optical budget to push a high-rate link into intermittent errors, and the failure rarely announces itself at the moment of installation. It surfaces months later as retransmissions or a channel that will not come up, at which point the question is no longer whether the link loses too much light but where along several kilometers it loses it.
An OTDR, or optical time domain reflectometer, is a single-ended test instrument that sends short pulses of light into a fiber and reconstructs the whole link from the tiny fraction of light that comes back. It reports the distance to every connector, splice, bend and break, the loss each one adds, the reflectance of reflective events, the fiber attenuation per kilometer and the total length of the span, all from one end and without disturbing the far end of the link.
The sections below explain how the instrument builds that picture, what each measurement means, how the four key settings shape the result, and where the technique earns its place in a real network.
How Does an OTDR Work?
An OTDR works by timing light rather than by measuring power at the far end. It launches a pulse, records the light that scatters or reflects back, converts the round-trip delay into distance using the fiber group index of refraction, and plots returned power against distance as a trace.
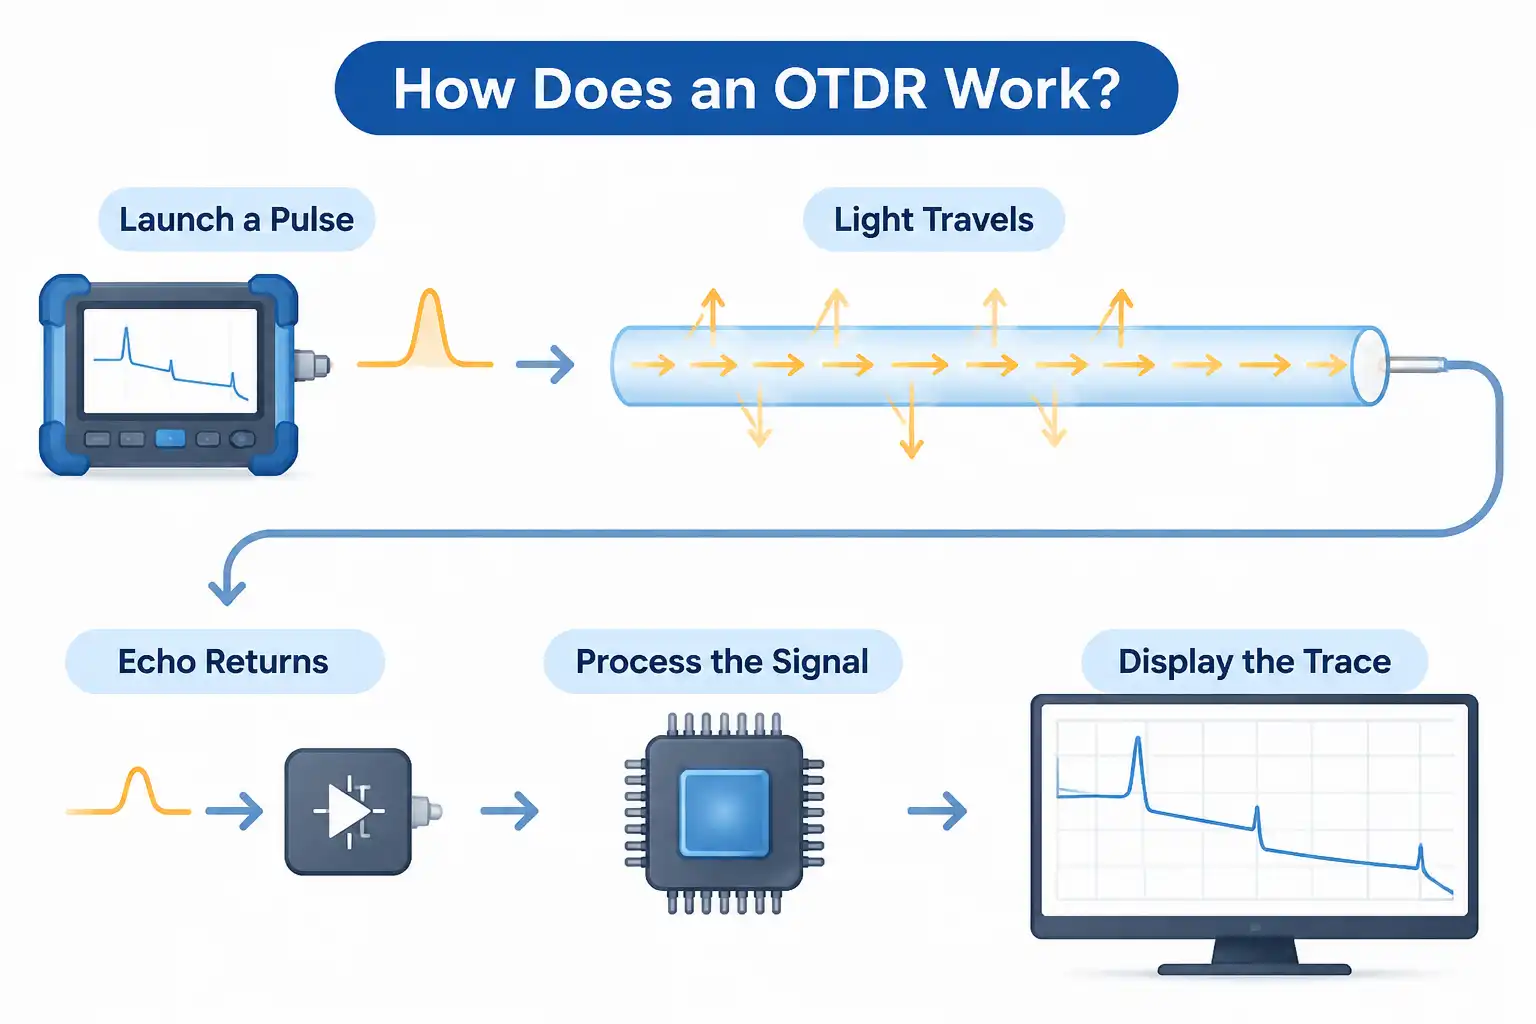
Nothing travels back to the instrument except a very small echo. A pulse of a few nanoseconds is injected, and as it moves down the fiber a fraction of its energy is redirected backward by the glass itself and by every discontinuity it meets. The instrument measures the arrival time of that echo, halves it to account for the round trip, and multiplies by the speed of light in the fiber core. Because the echo is so weak, thousands of pulses are fired and averaged before a single trace is displayed, which is why acquisition takes seconds rather than microseconds. A complete OTDR solution therefore combines a pulsed laser, a sensitive detector, a precise timing clock and firmware that turns raw samples into an event list.
Rayleigh Backscatter and Fresnel Reflection
Two different return mechanisms produce the trace, and reading an OTDR means telling them apart. Rayleigh backscatter comes from microscopic density variations in the glass and arrives continuously along the whole fiber, drawing the gentle downward slope that represents attenuation. Fresnel reflection comes from an abrupt change in refractive index, such as a glass-to-air boundary at an unmated connector or a cleaved end, and appears as a sharp spike thousands of times stronger than the surrounding backscatter. The physics behind both is well documented in reference literature on optical time domain reflectometry.
| Trace feature | Physical cause | What it tells you |
| Smooth downward slope | Rayleigh backscatter along the glass | Attenuation coefficient at the tested wavelength |
| Spike followed by a step down | Fresnel reflection at a mated connector pair | Connector loss and its reflectance |
| Small step with no spike | Fusion splice or angled connector | Splice loss, non-reflective by nature |
| Step with no spike mid-span | Tight bend, crush or mechanical damage | Localized stress needing physical inspection |
| Large spike at the end | Open end or unmated connector | Fiber end, or a break if shorter than expected |
What Does an OTDR Measure?
An OTDR measures six quantities: the distance to each event, the loss each event contributes, the reflectance of reflective events, the fiber attenuation coefficient, the total optical return loss of the link, and the overall length of the fiber under test.
These outputs answer different questions during acceptance and during troubleshooting, and the event table presents most of them as one row per event. Distance locates a fault precisely enough to send a crew to the right manhole, while loss values decide whether a splice or connector is acceptable. Reflectance matters most in short-reach single-mode applications, where standards set limits based on the number and reflectance of connectors rather than on total loss alone. Optical return loss aggregates every reflection in the link, and link length is the fastest check that the fiber route matches the as-built drawing.
| Measurement | Practical use |
| Event distance | Locating a break, a bad splice or a suspect connector |
| Event loss in dB | Judging splice and connector quality against a threshold |
| Reflectance in dB | Flagging dirty, scratched or mismated connectors |
| Attenuation in dB/km | Verifying that cable meets its specified loss |
| Optical return loss | Checking links sensitive to reflected power |
| Link length | Reconciling the physical route with documentation |
What Are the Four Parameters of an OTDR?
The four parameters of an OTDR are wavelength, pulse width, distance range and averaging time. Wavelength determines what the instrument can detect, pulse width trades resolution for reach, distance range sets the recording window, and averaging time buys signal-to-noise ratio at the cost of test duration.
A fifth setting, the index of refraction, belongs to the same screen but is not usually counted among the four, because it is a property of the fiber rather than a test choice. It still matters: an incorrect index shifts every distance reading on the trace, so fiber type should be confirmed before the first pulse is fired. The table below summarizes how each of the four behaves when it is turned up.
| Parameter | Turning it up buys | Turning it up costs |
| Wavelength | Reach, since 1550 nm attenuates less than 1310 nm | Sensitivity to bends, and meaningless dB/km if the fiber type is wrong |
| Pulse width | More returned energy, so the trace survives to the far end | Resolution, because closely spaced events merge and dead zones widen |
| Distance range | A wider recording window | Thinner sampling across the span, with no gain in accuracy |
| Averaging time | A cleaner noise floor at the far end of the trace | Acquisition time, the only setting that costs no accuracy |
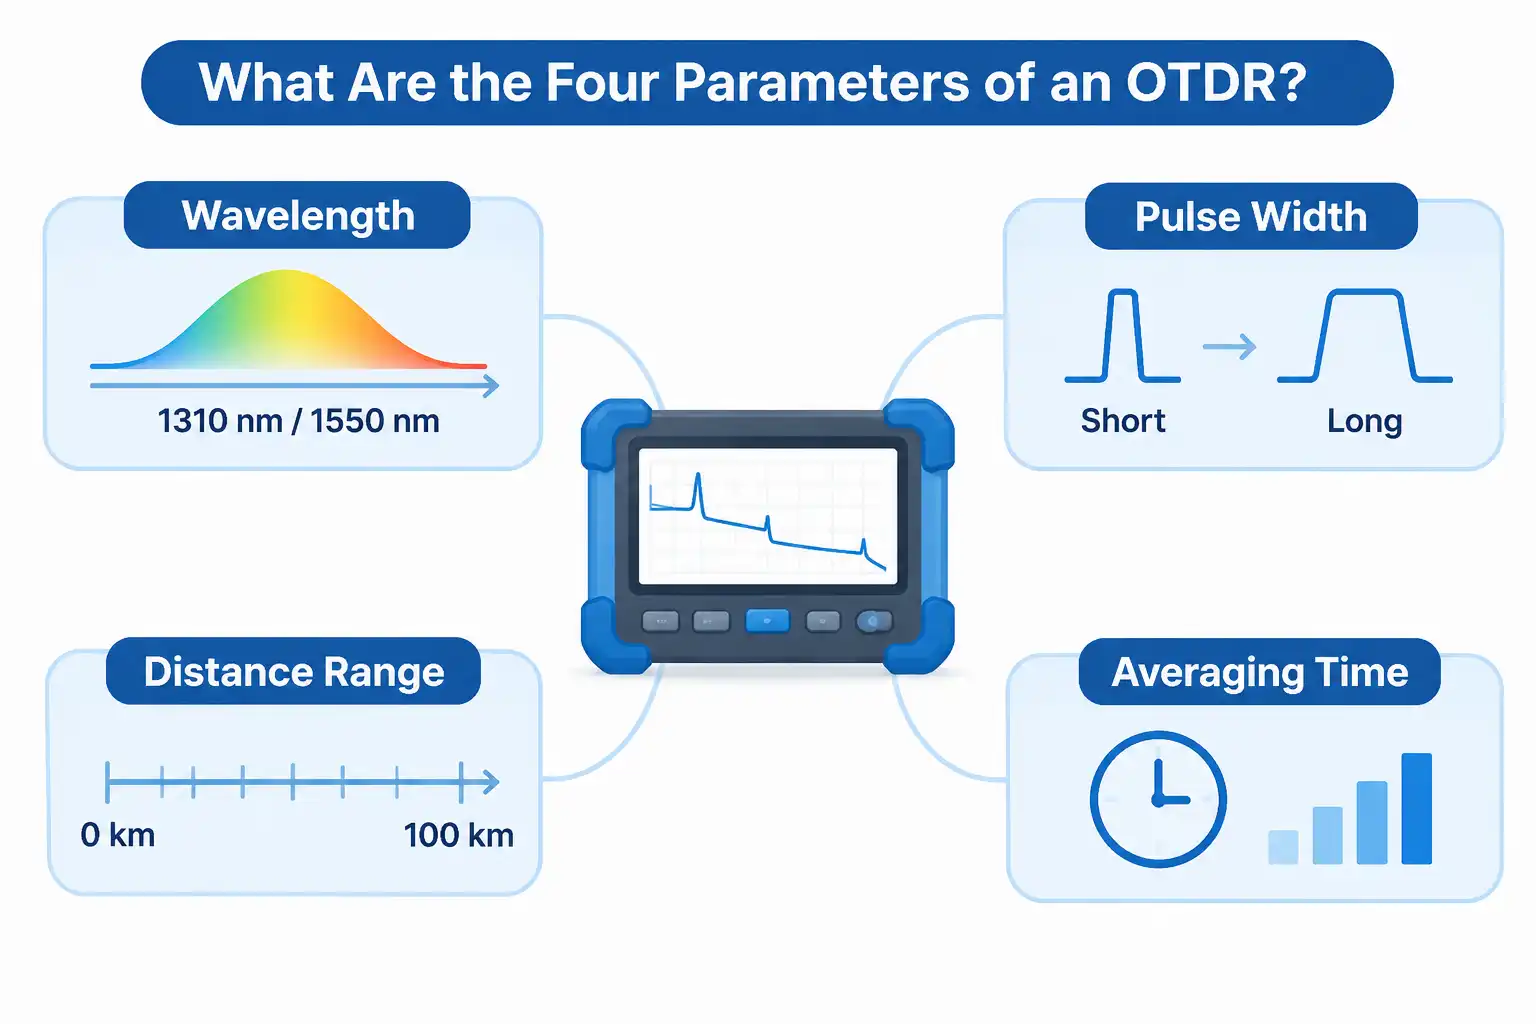
Field practice follows one rule: use the shortest pulse width that still reaches the end of the link with a reasonable number of averages. Launch and receive fibers of known length, typically 50 to 150 m on premises links and much longer on outside plant, move the first and last connectors out of the dead zones so they can actually be measured.
Dynamic Range and Dead Zones
Two datasheet figures decide whether an instrument can do a given job. Dynamic range, expressed in dB, describes how much loss the receiver can see through; a 1×32 passive splitter adds roughly 15 to 17 dB and a 1×64 splitter close to 20 dB, which is why access networks demand high dynamic range. Dead zones describe blindness rather than reach. The event dead zone is the minimum spacing at which two reflective events can be separated, and the attenuation dead zone is the distance after a strong reflection over which loss can be measured again. Data centers and tower-top links, with short spans and many connectors packed together, live or die by these two numbers.
What Is the Purpose of an OTDR Test?
The purpose of an OTDR test is to prove that a link was built correctly and to locate what went wrong when it was not. It turns a single total loss figure into a per-event record showing which connector or splice is responsible, at what distance, and with how much loss.
That record serves four purposes. It documents acceptance, giving the owner evidence that every splice met its threshold rather than only that the link passed overall. It supports troubleshooting, because a technician can send a crew to a distance instead of patrolling a route. It establishes a baseline, so a trace taken years later can be compared point by point with the day the link was handed over. And it feeds network monitoring solution platforms that poll fiber links continuously and raise an alarm when a span degrades before service drops.
| Tier 1 testing | Tier 2 testing |
| Measures total insertion loss, length and polarity | Characterizes every individual event along the link |
| Fast, and sufficient for many acceptance contracts | Catches a poor connector masked by a low-loss neighbor |
| Confirms the link sits inside its loss budget | Adds distance, reflectance and per-event loss data |
| Cannot isolate where loss occurs | Cannot replace the end-to-end loss measurement |
The two tiers are complementary rather than competing: extended characterization by reflectometry is defined within the test methods that international standards specify for installed links, as set out in ITU-T G.650.3. A reflectometry trace does not replace a calibrated end-to-end loss measurement, and no amount of trace analysis recovers a link that fails its insertion loss budget.
How Do You Interpret OTDR Test Results?
Read the trace from left to right, then confirm every event in the event table by distance, type, loss and reflectance. The trace is evidence rather than a verdict: each event is compared against the project threshold, and splice loss is averaged across both test directions before it is accepted.
The reading order is always the same. Start at the left edge, where the launch fiber terminates, confirm the first connector appears as a spike outside the dead zone, follow the slope across each span, and check that the far end shows a clear reflection or a clean termination. A slope that steepens locally means excess loss in that section; a step that appears where no splice exists means physical damage. The event table then converts the picture into numbers. Splice acceptance thresholds are usually tight enough that a good splice below 0.1 dB will not be listed at all if the instrument threshold is set higher, so the threshold itself has to be checked before concluding that a splice is missing.
Ghosts, Gainers, and Other Artifacts
Two artifacts mislead inexperienced readers. Ghosts are false reflective events spaced at exact multiples of a real reflection’s distance, produced when strong reflections bounce back and forth; they carry no loss, so a ghost can be recognized by its symmetry and removed by shortening the pulse or adding attenuation at the launch. Gainers are the opposite problem, an apparent negative splice loss caused by two fibers with different backscatter coefficients being joined; the true loss only emerges when both directions are averaged, which is the method the Fiber Optic Association recommends for any splice measurement used in acceptance.
Where Are OTDRs Used?
OTDRs are used wherever a fiber link has to be qualified or repaired from one end: access and passive optical networks, metro and long-haul spans, data center trunks, tower-top radio links, campus backbones, and pipeline or structure monitoring installations.
Each environment stresses a different capability, which is why wavelength sets and dead zone specifications diverge so much between instruments.
| Environment | Typical test target |
| Access and passive optical networks | Splitter loss, drop cable faults, per-subscriber isolation |
| Metro and long-haul spans | Splice quality, span loss uniformity, distance to fault |
| Data centers | Short patch-heavy links, connector cleanliness, multi-fiber trunks |
| Tower-top and radio access | Jumper and connector loss in weather-exposed joints |
| Campus and enterprise backbones | Riser and inter-building acceptance records |
| Pipelines, power cables and structures | Distributed sensing alongside loss testing, including distributed temperature sensing over the same fiber |
How Do You Choose the Right OTDR?
Choose the form factor first, then the three specifications that limit real work: wavelength set, dynamic range and dead zone. Everything else, from touchscreen size to report software, is convenience rather than capability.

Handheld units dominate field work because they are battery powered and sealed against weather. Benchtop instruments trade portability for laboratory-grade stability and are usually found in manufacturing or calibration labs. Modular or rack-mounted cards embed the same measurement engine in a monitoring platform, where tests run on a schedule instead of on demand; a rack-level OTDR system is typically specified by channel count and remote control interface rather than by screen. Whichever form is chosen, the checklist is short: does the wavelength set cover both single-mode and multimode links, is dynamic range sufficient to see through the splitters in the network, are dead zones short enough for the densest link, is there a filtered port for testing fiber that carries live traffic, and can results be exported as standard trace files for the acceptance package.
FAQ
Three questions tend to surface once the instrument and its settings are settled.
Can an OTDR test multimode fiber?
Yes, with 850 nm and 1300 nm sources and a launch fiber matched to the core size. Multimode traces are noisier because backscatter is stronger and links are short, so the practical use is fault finding rather than acceptance certification.
Is a single-ended test enough for acceptance?
Rarely. Most specifications and warranties require bidirectional measurement with averaged splice losses, because backscatter differences between two joined fibers bias the result depending on which end is tested.
How often should a link be re-baselined?
After any re-splice, re-termination or route change, and otherwise on the interval the operator sets for critical spans. A stored trace is only useful for comparison if the settings that produced it are recorded with it.